Most of us don’t fully understand the concept of virtual water, which is actually important for us to know. It is more commonly known as the water footprint, which means the amount of water needed to produce some products or any goods and services.
Take a look at a ton of wheat that we can use to make loaves of bread. It’s common to think that the main ingredients for making bread are wet; However, the real situation is not like that. Because in reality, we don’t only need the wet, but also a lot of other things like water, salts, etc. Now, the focus is on the amount of water used in making these loaves of bread. To produce one ton of wheat, we need about 1,600 cubic meters of water on average. These 1,600 cubic meters is the virtual water or water footprint.
Your understanding of how this concept works will help us determine how much water is needed to produce different kinds of goods and services. This knowledge will be very useful in determining how to use our water resources wisely. Water is very scarce, and we cannot use all the water available on Earth for our consumption. That’s why water consumption will also be a part of our food hygiene and food safety course
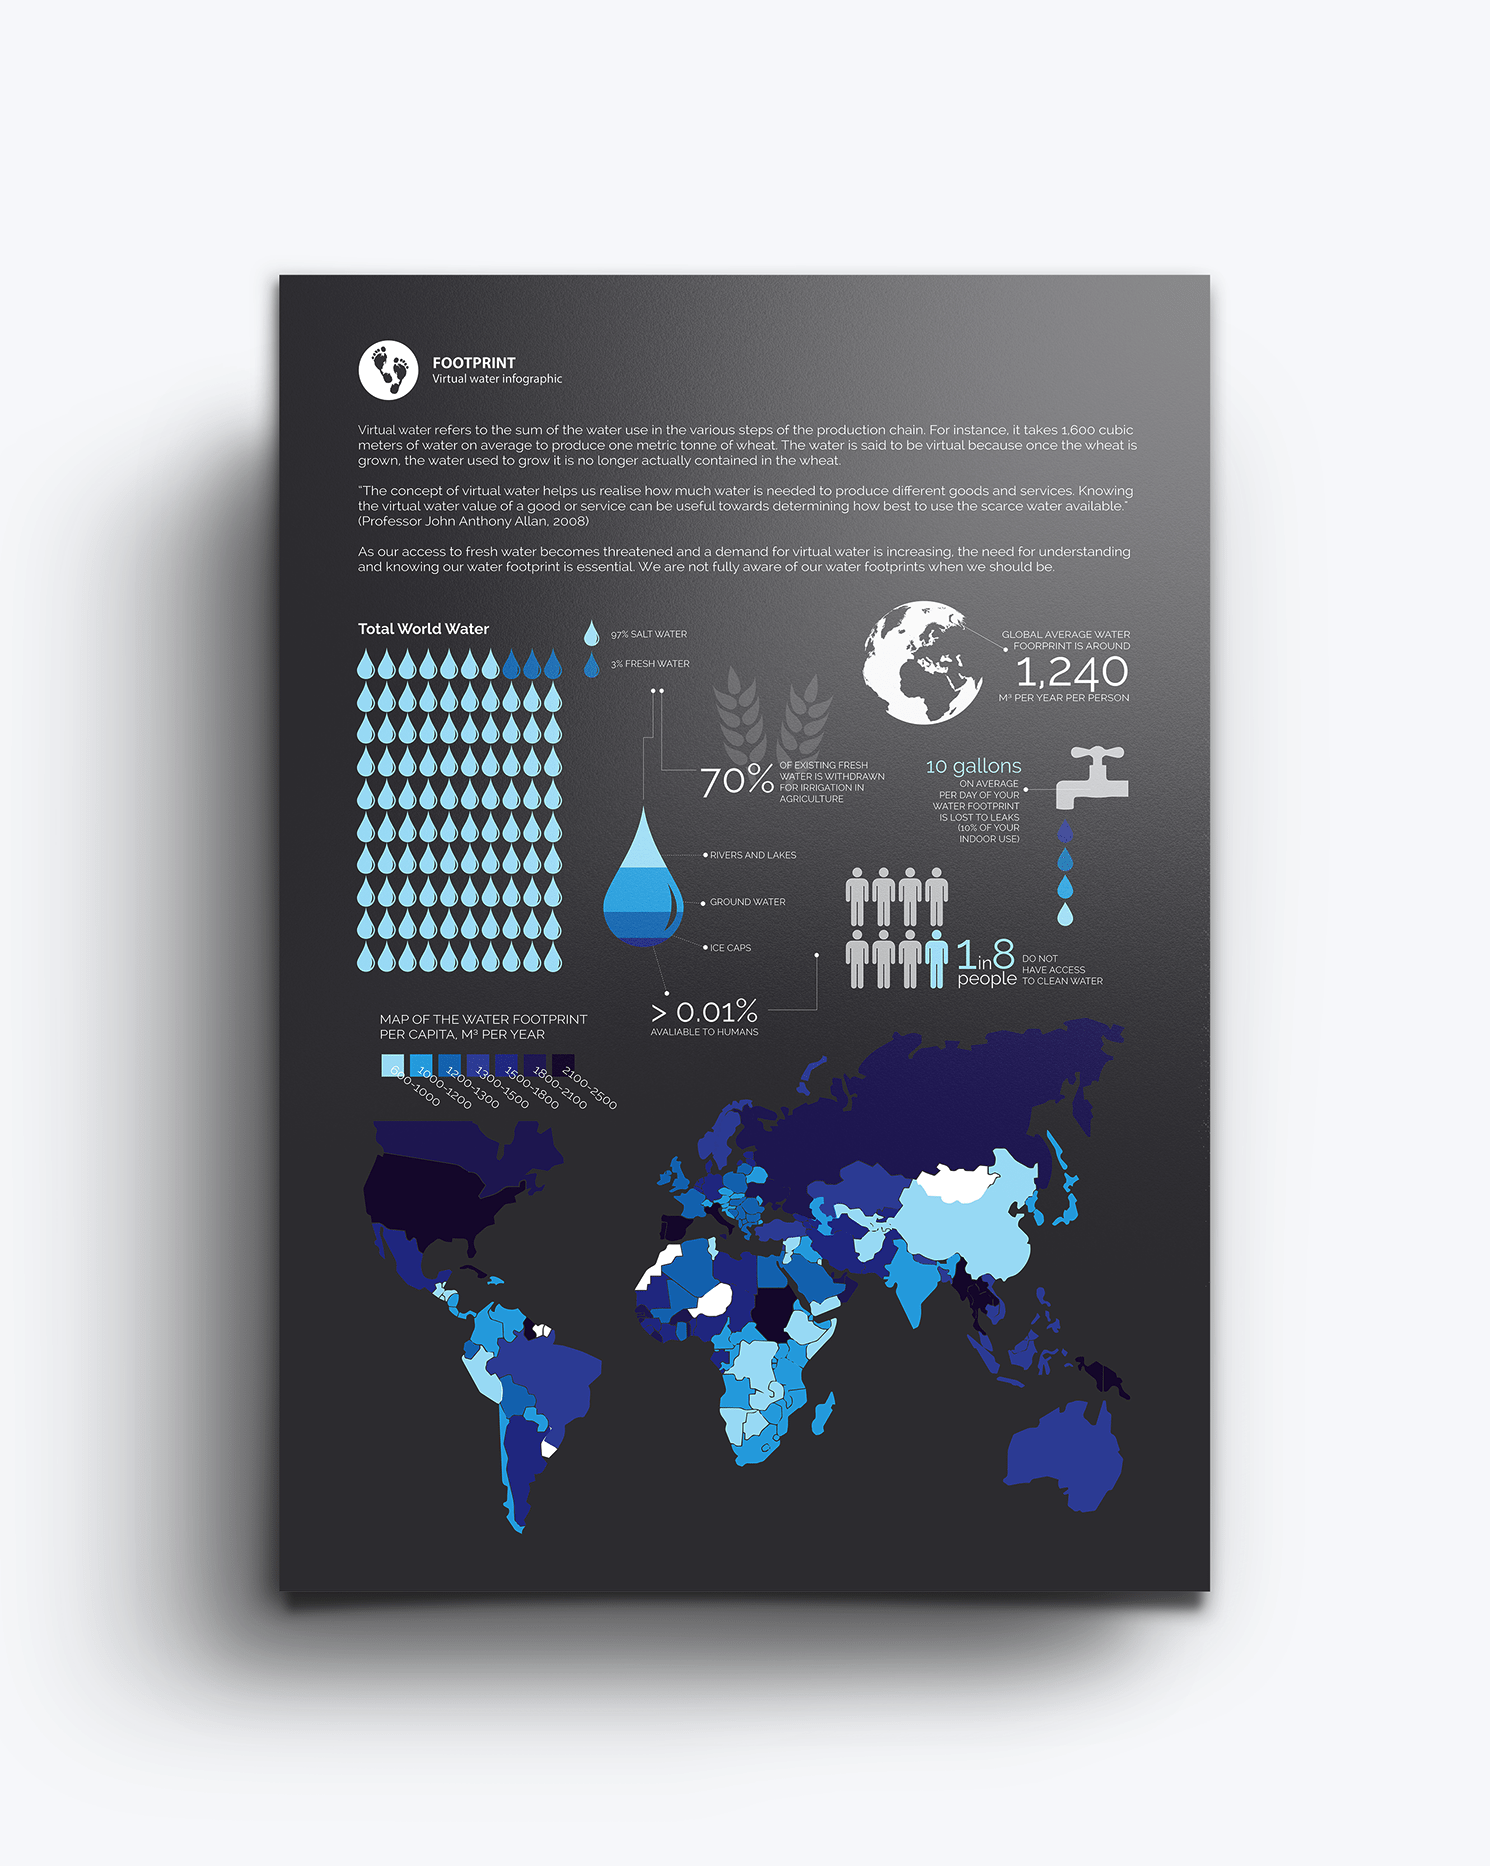
There’s a real nice infographic from Behance regarding this matter, as we can see below:
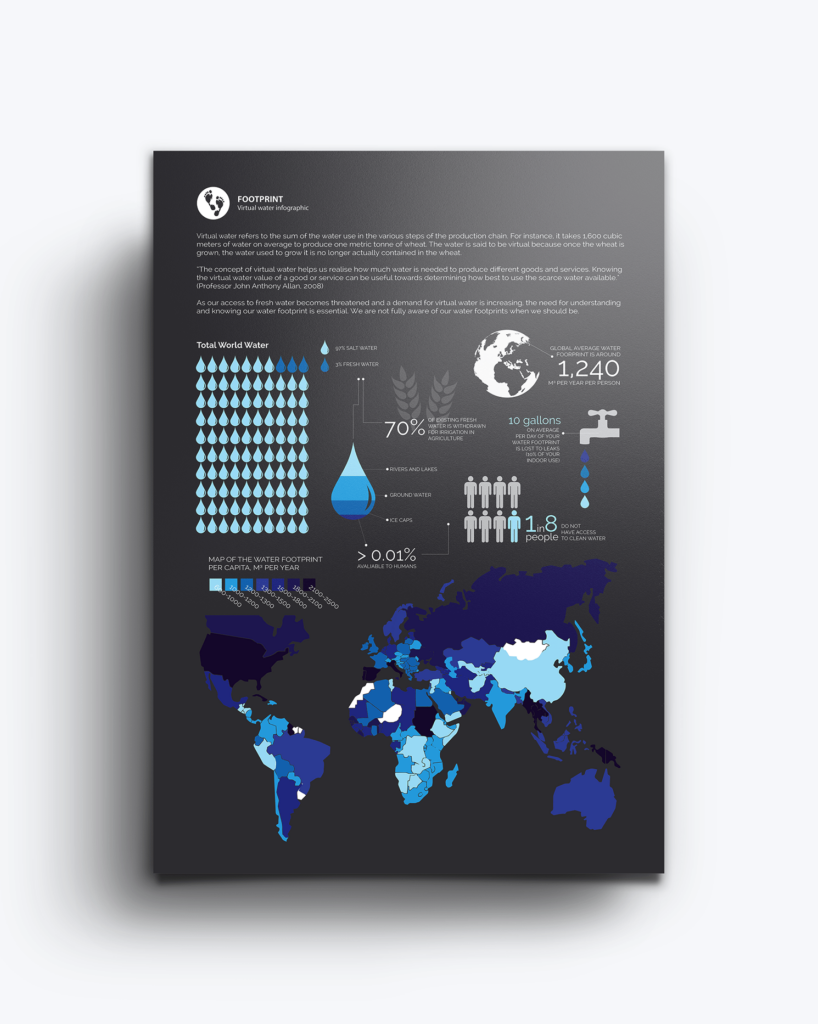
Here we can see the visualization of water usage around the world. We may notice from the infographic above that there is a significant amount of water on Earth, but only 3% of it is freshwater available for our daily use. Moreover, only 0.01% of this freshwater is accessible to us, while the remaining 97% is not usable.
From the provided infographic, we see that of the 3% of freshwater available, 70% is withdrawn for agricultural use, which is also used for food production. We cannot use this water 100% because most of it is available in the form of rivers, lakes, and groundwater.

From the graph, we can see that on average, the waterfront is 1,240 cubic meters per capita per year. This indicates a significant amount of virtual water consumption for every person in the world. Additionally, about 12.5% of people (884 million) are unable to access clean water, highlighting the importance of being grateful if you have access to clean water. The infographic also depicts an interesting fact: for every single slice of bread we consume, at least ten gallons of water are used.
In the infographic, we can also see the global map that shows the water footprint usage per capita for many different countries. Each country has different shades of blue indicating the levels of their respective water usage. To interpret this correctly, we should know that the darker the color, the more water the country uses, and the lighter the color, the less water it uses.
Water is a limited resource, and we should take greater care by using it sparingly. This doesn’t mean we should stop using water altogether, but we should aim to use it as efficiently as possible. Particularly in countries with high water consumption, we should consider ways to reduce usage and influence the community and government to adopt more efficient practices.
In the infographic, we can see some visible elements, such as a large water droplet illustrating the distribution of freshwater. There’s also an icon representing people, showing how many have access to clean water and how many do not, or in other words, the proportion of access to freshwater globally. The last element is a globe icon representing global statistics.
All in all, the infographics aim to raise our awareness about water usage on a global scale and highlight the importance of understanding and managing our water footprint in daily life.